.png)
Scaling Acquisition Across a 14 Location Electrician Franchise Without Breaking Local Economics
Category: Home Services (Electrical)
Footprint: 14 Franchise Locations
Channel: Google Ads with Revenue Tracked Through Internal Dashboards
BACKGROUND
Why Franchise Marketing Breaks So Easily
At a distance, marketing a franchise looks simple. There is one brand, one promise, and a centralized budget. In reality, acquisition across a franchise network is one of the most fragile growth problems in home services.
This electrician business operated across fourteen locations, each responsible for its own staffing, bookings, cancellations, and revenue, while marketing decisions were made centrally. From the outside, it looked like one company. From the inside, it behaved like fourteen different businesses, each with its own economics and operational maturity.
This is where most franchise marketing quietly fails. When outcomes are uneven, the instinct is to “optimize the account,” adjust bids, or chase platform metrics. But the real challenge isn’t visibility or volume. It’s building one acquisition system that scales while still respecting the reality that every territory answers calls differently, prices jobs differently, cancels differently, and converts differently.
When I stepped in, my role was not to run ads for a single company. It was to build a growth system that worked for fourteen independent P&Ls wearing the same logo.
THE PROBLEM
Clean Dashboards, Messy Reality
Before taking full control, performance discussions were fragmented and difficult to resolve. Google Ads showed activity, leads were coming in, and spend was being deployed consistently across the network. Yet local teams were experiencing wildly different outcomes. Some locations were growing comfortably. Others were overwhelmed with low-quality demand or bleeding through cancellations and unbooked calls.
The core problem was not visibility. It was clarity.
At the network level, results were being evaluated through the Google Ads interface, which is useful for optimization signals but misleading as a source of business truth. Google Ads does not know what gets booked. It does not know what cancels. It does not know which calls turn into revenue. In home services, that gap between platform reporting and operational reality is where profit quietly disappears.
Without a shared definition of what a “lead” actually meant, cost-per-lead figures were being debated without context. Without clean attribution, phone calls were difficult to tie back to spend with confidence. And without a system that separated marketing performance from operational execution, every issue eventually circled back to “the ads,” even when the leak was elsewhere.
This is the tension at the heart of franchise marketing: the franchisor needs predictability and scale, while each location needs economics that make sense locally.
THE TURNING POINT
Taking Full Control
I began consulting in December 2024, but the real inflection point came roughly ten months later. About two and a half months before the end of this reporting window, I took full operational control of the Google Ads accounts across the entire network.
That shift allowed for two critical changes.
First, performance could finally be evaluated through the lens of business reality rather than platform abstraction. Second, the acquisition system could be designed holistically instead of being patched location by location.
To keep the analysis clean, performance was measured using weekly internal dashboard reporting. I compared ten full weeks immediately before takeover (August 4, 2025 to October 6, 2025) against ten full weeks immediately after (October 13, 2025 to December 15, 2025). This removed seasonality noise and isolated the impact of system-level changes.
THE SYSTEM
Standardization Without Pretending Every Location Is the Same
The foundation of the solution was not more aggressive bidding or creative tweaks. It was building a system that could scale without flattening local reality.
A standardized account structure was enforced so that every location could be measured honestly and compared apples-to-apples. Campaign structure, naming conventions, and conversion definitions were aligned so that a “lead” meant the same thing across fourteen markets. Without this, performance comparisons are meaningless, and optimization becomes political rather than analytical.
At the same time, localization was treated as non-negotiable. Some territories had higher average tickets. Others had weaker booking teams or staffing constraints. Competitive pressure varied market by market. Instead of enforcing a single corporate CPL target, acceptable acquisition costs were tuned based on downstream behavior and unit economics. A target is not a value judgment, it’s math.
Attribution was cleaned by implementing Google-Ads-only phone numbers, both in ads and dynamically on the website. This created a clearer line from spend to calls, bookings, cancellations, and revenue, without relying on Google’s interpretation of outcomes.
Most importantly, optimization stopped at “qualified lead,” not raw volume. In home services, scaling demand without intent control simply inflates cancellations and operational friction. By tightening intent alignment and expectation setting, volume could scale without collapsing quality.
MEASUREMENT
Why Google Ads Was Not Treated as the Source of Truth
For this case study, Google Ads reporting was intentionally not used to measure success. It was used as an optimization tool, not as the arbiter of truth.
All results are based on internal dashboards tracking the full chain: qualified lead creation, booking, cancellation, and revenue collection. Only leads that were internally audited and marked as qualified were included — not every phone call or form submission.
This distinction mattered. It ensured that when CPL dropped or bookings increased, those improvements reflected business reality, not reporting artifacts.
IMPACT
What Changed in Ten Weeks
Once the system was in place, the results were immediate and measurable.
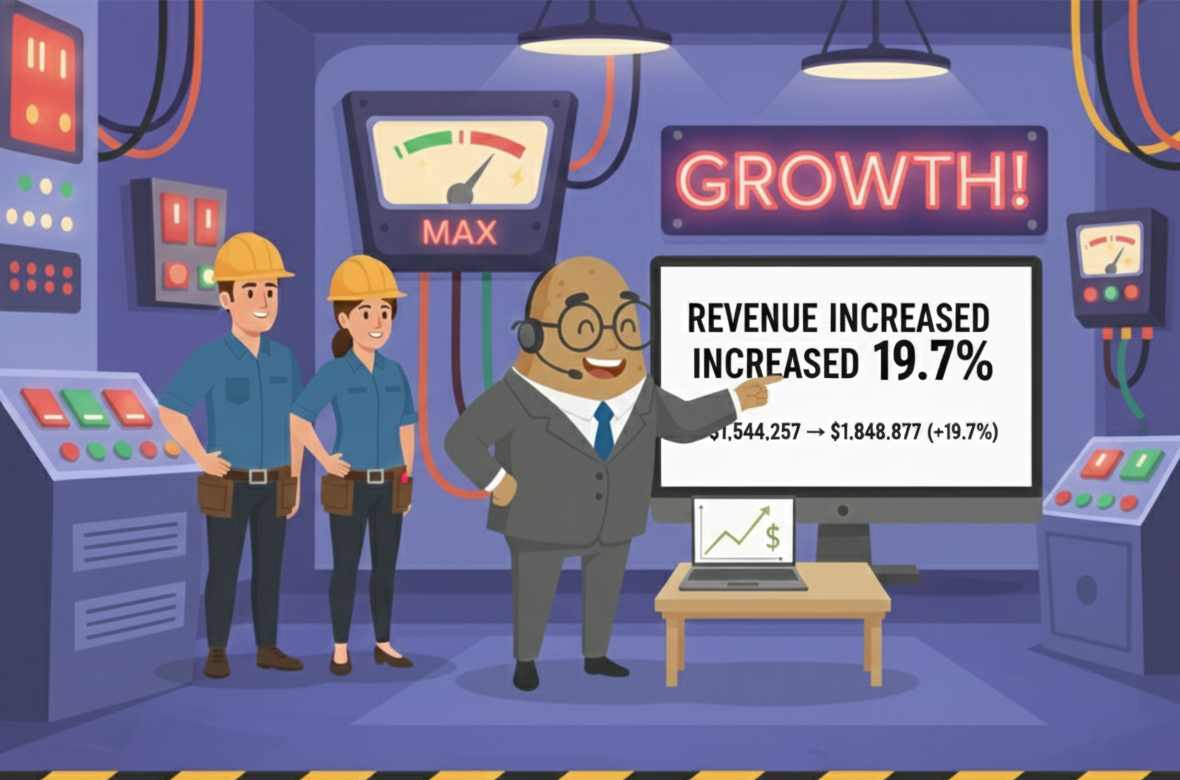
Across the network, tracked revenue increased from $1.54M to $1.85M over the ten-week period, a 19.7% lift, while ad spend declined slightly by 3.2%. Revenue-to-spend efficiency improved from 3.83× to 4.74×, reflecting a 23.7% increase in return.
The acquisition funnel scaled meaningfully. Qualified leads rose by 37.8%, increasing from 1,493 to 2,058. Bookings followed closely behind, increasing by 33.6% from 1,301 to 1,738. Crucially, this growth did not come at the expense of quality.
Cancellation rates improved from 16.45% to 13.86% despite the higher booking volume. At post-takeover levels, that reduction equated to roughly 44–45 fewer cancellations than would have been expected if prior behavior had held. In home services, that is operational relief — not just a marketing win.
Efficiency gains were just as significant. Cost per qualified lead dropped nearly 30%, from $270 to $190. Cost per booking declined from $310 to $224. These improvements created space for growth without requiring additional budget pressure.
THE HONEST TRADEOFF:
Revenue Per Booking Declined
One result deserves explicit transparency. Revenue per booking declined by approximately 10.4% during the post-takeover window.
This decline was visible in internal reporting, but its exact cause could not be isolated to marketing alone. In a franchise system, revenue per booking is primarily driven by pricing, job mix, and sales execution — all of which vary by location.
What matters is the system-level outcome. Even with a lower average ticket, total tracked revenue increased materially and efficiency improved. The system produced more revenue on less spend while reducing cancellations, indicating that gains outweighed the tradeoff.
Beyond the Snapshot: Proof It Wasn’t a Fluke
To control for seasonality, performance during the early-holiday period was compared year-over-year. Between early November and mid-December, tracked revenue increased by 27.7% year over year while spend declined by over 21%. Revenue-to-spend efficiency improved by more than 60%, and cancellation rates dropped dramatically.
Looking at quarterly trends reinforced the story. From late 2024 through 2025, revenue-to-spend steadily improved while CPL, CPB, and cancellation rates declined. By mid-December 2025, the network was operating at a 4.6× revenue-to-spend ratio with materially healthier unit economics.
The Real Lesson
This case study is not about outsmarting Google Ads.
It is about recognizing that franchise growth lives inside a chain: ad → qualified lead → answered call → booking → kept appointment → revenue. Marketing can push the front of the chain. Operations determine the back half.
Sustainable growth requires a system that is standardized enough to scale, localized enough to remain profitable, and disciplined enough to move budget based on reality rather than averages or politics.
After taking full control, the next ten weeks delivered higher revenue, lower costs, stronger efficiency, and fewer cancellations across fourteen independent businesses.
That is the work franchise growth actually demands.