



Rebuilding the Foundation of a Healthcare eCommerce Google Ads Account and Scaling to 3,055 Purchases in Six Months

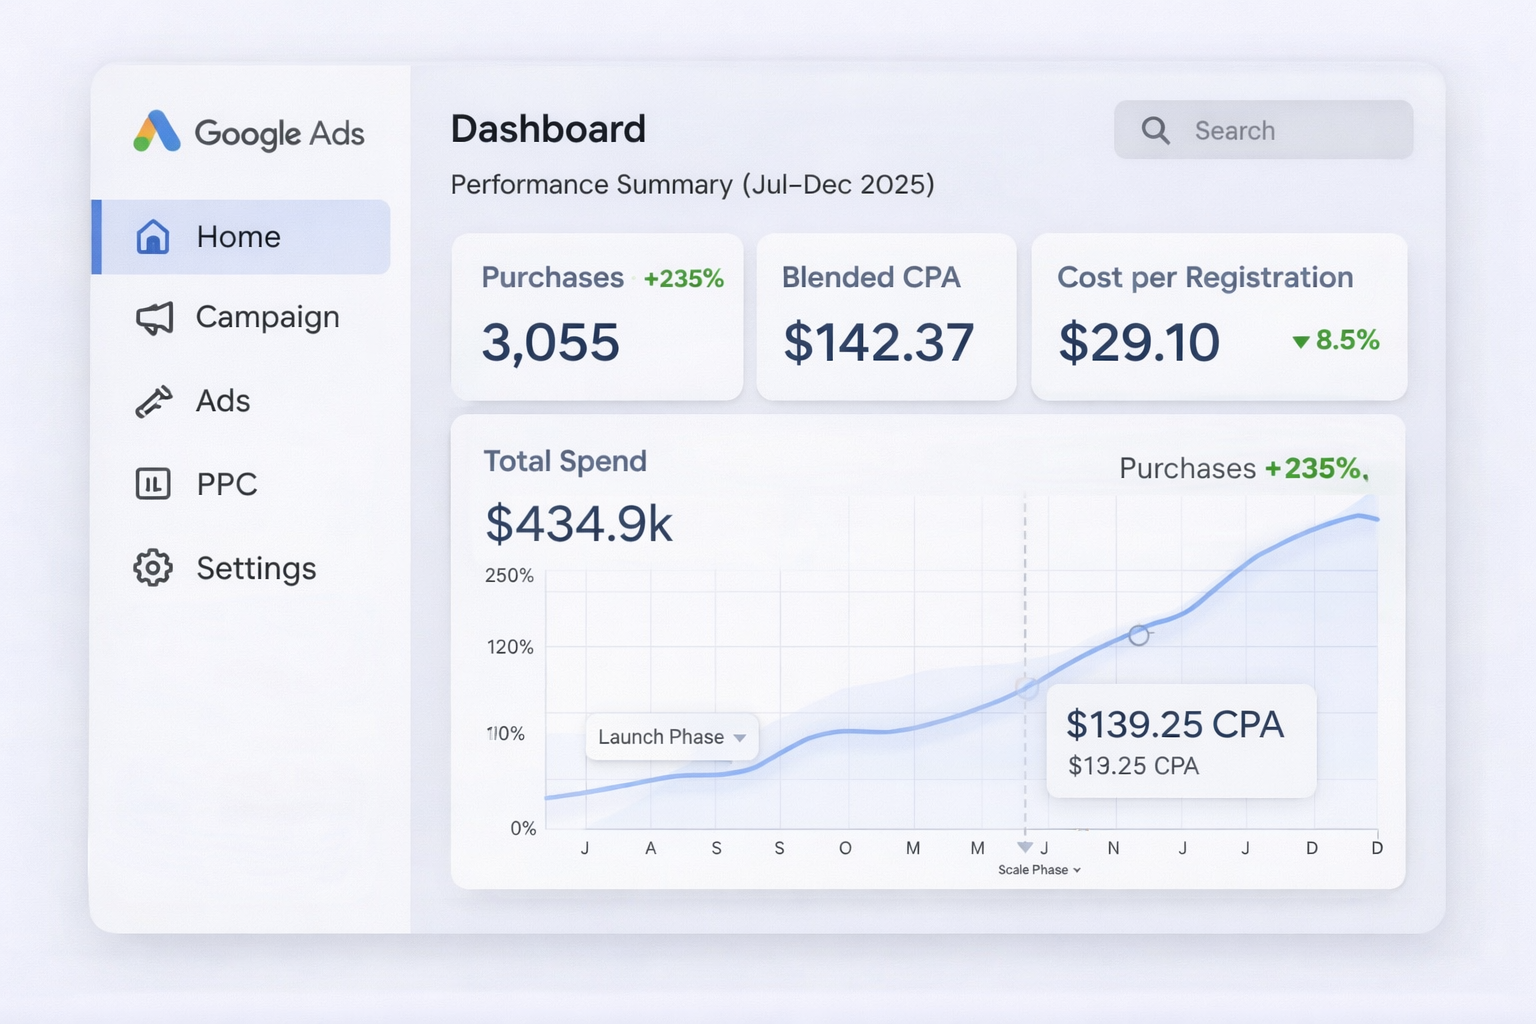
A broken measurement foundation was rebuilt into a scalable Google Ads acquisition system, enabling 3,055 purchases in six months while improving CPA as spend increased.

3,055
Purchases
$142.37
Blended CPA
+235%
Purchase growth during scale phase
-8.5%
Cost per registration

The Challenge

Why Healthcare eCommerce Does Not Scale Like Normal eCommerce

Healthcare eCommerce can look like standard direct-to-consumer retail from the outside, but inside paid acquisition it behaves very differently. Compliance constraints, platform eligibility rules, and product restrictions introduce friction at nearly every layer of scale.

For most eCommerce brands, Google Shopping is one of the clearest channels for capturing high-intent demand. In healthcare, that channel is often delayed or blocked by approvals and policy requirements. At the same time, when purchase tracking is incomplete, businesses tend to optimize toward proxy metrics like registrations. That may keep an account running, but it breaks the moment real scale is required.

The Core Problem

The Account Could Not See Revenue Clearly Enough to Scale

Before the rebuild, the account was active and spending, but it was not structurally capable of scaling efficiently.

Purchase tracking was unreliable

  • Registrations were recorded consistently, but purchases were not being captured reliably enough to serve as the main optimization signal.

Google Shopping was not live

  • Merchant Center was not fully set up, which meant one of the highest-intent acquisition channels was missing.

Scaling would have amplified noise

  • Without clear purchase data or Shopping inventory, increasing spend would have meant spending harder, not spending smarter.

The Turning Point

Fix the Tracking and Feed Before Scaling Spend

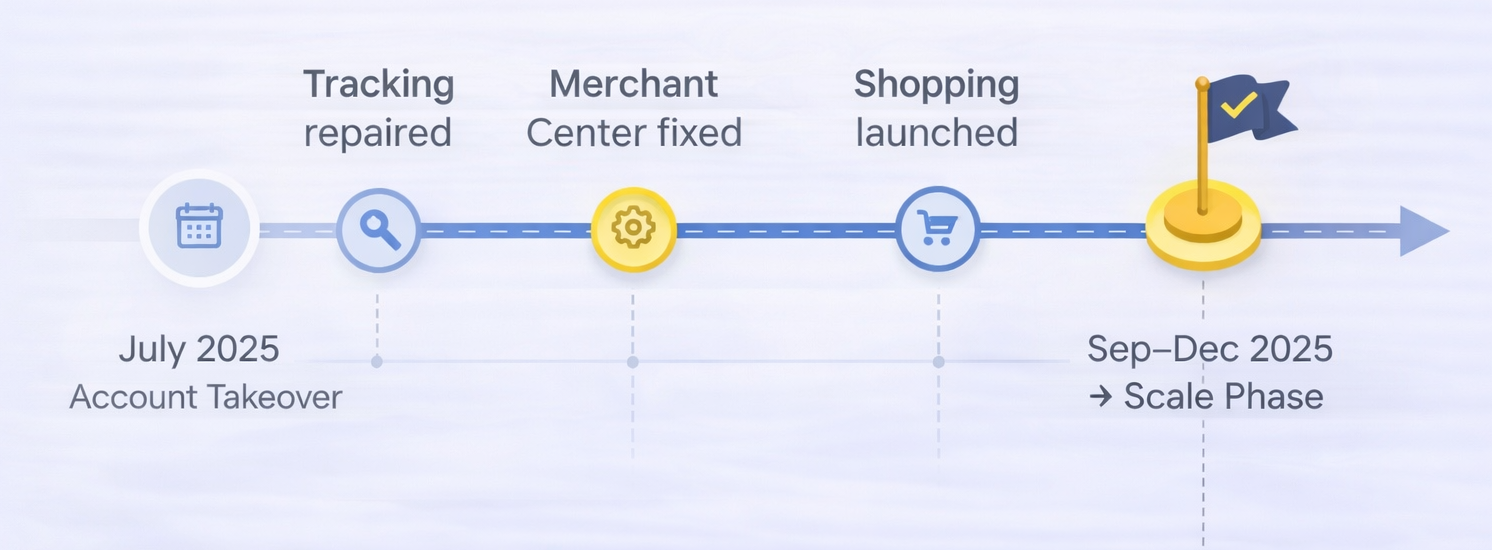
The first phase of work was not optimization in the traditional sense. It was infrastructure. Purchase tracking was repaired so transactions could be captured consistently and used as the primary performance signal inside Google Ads. That immediately improved decision quality because the account could finally optimize toward actual purchases instead of relying on upstream proxies.

At the same time, Merchant Center was fixed and brought online, allowing Google Shopping to launch. In this category, that step alone can be the main blocker to scale. Once Shopping was approved, compliant, and stable, the account gained access to demand that had previously been unavailable.

Only after those two pieces were in place did spend begin to scale.

WHAT CHANGED

Rebuilding the Foundation Before Chasing Volume

The system did not improve because of one tactic. It improved because the account was rebuilt around the right growth prerequisites.

Purchase tracking repaired

  • Actual transaction data became the main optimization signal.

Merchant Center fixed

  • Feed infrastructure was stabilized so Shopping could become viable.

Google Shopping launched

  • High-intent demand became accessible for the first time.

Optimization tied to purchase CPA

  • Registrations remained useful, but only as a quality-control metric, not a revenue substitute.

Measurement Approach

How Performance Was Measured

Success was measured using Google Ads export data across cost, purchases, CPA, and registrations. Purchase CPA became the primary KPI, while registrations were treated as a supporting quality metric rather than the end goal.

Because purchases could be fractional due to attribution/modeling, results are shown through December 28, 2025 to avoid a partial week.

THE IMPACT

What Changed in Ten Weeks

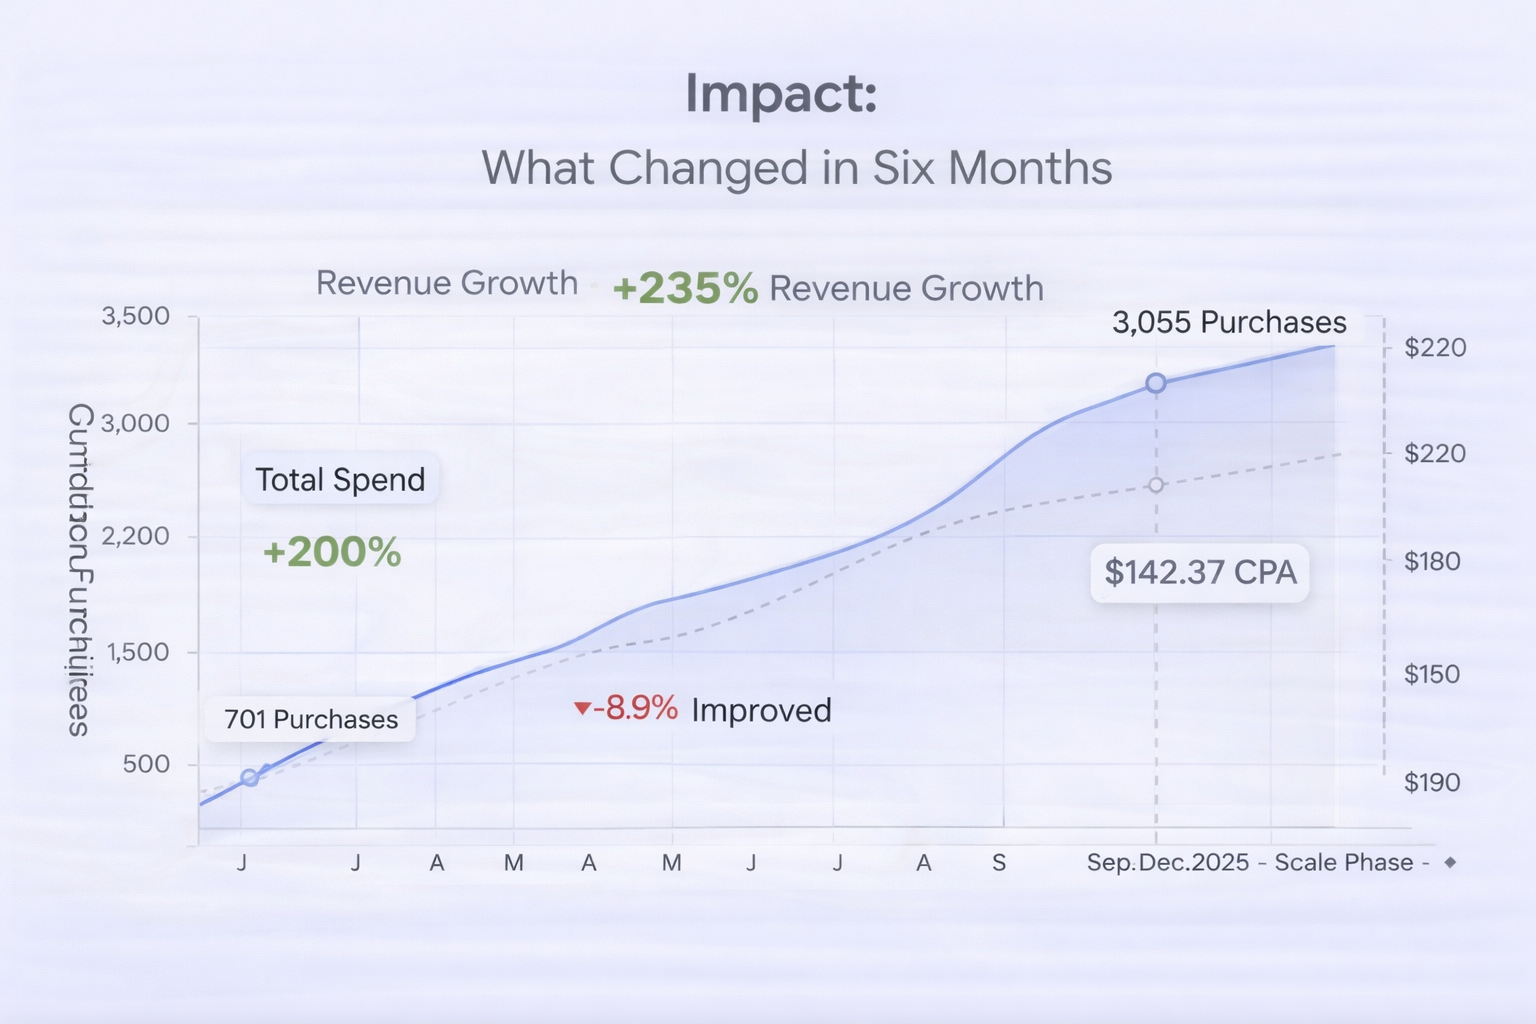
Between July 1 and December 28, 2025, the account generated 3,054.83 purchases on $434,905 in spend at a blended $142.37 CPA. It also drove 14,947 registrations at an average $29.10 cost per registration, with 20.44% of registrants converting into purchasers.

What made the performance notable was not just the absolute volume, but how it behaved under scale. From the launch phase to the scale phase, spend increased by more than 200%, purchases increased by more than 235%, and CPA improved from $152.80 to $139.25.

Performance Summary (Google Ads)

Launch vs Scale vs Total — July 1 to Dec 28, 2025

Metric Launch Phase (Jul–Aug) Scale Phase (Sep–Dec) Jul–Dec Total
Spend $107,226 $327,679 $434,905
Purchases 701.74 2,353.09 3,054.83
CPA $152.80 $139.25 $142.37
Registrations 3,445 11,502 14,947
Cost per Registration $31.13 $28.49 $29.10
Reg → Purchase Rate 20.37% 20.46% 20.44%

Notes: Purchases may be fractional due to attribution/modeling. Results shown through Dec 28, 2025 to avoid a partial week.

The Honest Part

Where Performance Softened

December was weaker than the September–November stretch. CPA rose, and the registration-to-purchase rate declined modestly. In healthcare eCommerce, that is not unusual. Auction pressure changes, seasonal behavior shifts, and product mix evolves near year-end.

What matters is that the weakness was not structural. Purchase tracking remained reliable. Google Shopping stayed live. Optimization was still grounded in purchase-level data. The system held; the environment changed.

VALIDATION

Why the Economics Worked

Estimated customer lifetime value sat in the $400–$600 range. At a blended CPA of roughly $140, paid acquisition still operated with meaningful margin and room for further optimization. That gave the system enough headroom to absorb volatility while remaining scalable.

CONCLUSION

The Takeaway

This account did not scale because spend was pushed harder. It scaled because the foundation was rebuilt first. Reliable purchase tracking replaced guesswork. Merchant Center and Google Shopping unlocked high-intent demand. Optimization decisions were tied to revenue instead of proxy metrics.

The result was 3,055 purchases in six months at approximately $142 CPA, with efficiency improving as the account moved from launch into scale. That is what sustainable growth actually looks like in healthcare eCommerce.

Contact us

Ready To Build More Predictable Growth?

If you're done guessing, reacting, and relying on random tactics, the next step is simple.Fill out the form below to start building a clearer, more profitable growth system.

Results · E-commerce

How a healthcare e-commerce account grew to about $89K a month at $141 per purchase

I took over a healthcare e-commerce brand’s Google Ads in July 2025. Over the next six months the account spent $491,234 and recorded 3,096 purchases. From September to December, spend averaged about $88,600 a month and each purchase cost $141.23.

July was the expensive month. Purchase tracking was the first thing I fixed, and July recorded 128 purchases on $62,760. Every month after it came in between $136 and $161 per purchase. July is on this page, and so is a softer December.

Want this checked on your own account? The New-Customer Read is a free 30-minute review of your Google Ads with me. Get my New-Customer Read

On this page

What did the six months look like?

Google Ads, every campaign in the account, July 1 to December 28, 2025
MonthAd spendPurchasesCost per purchase
July$62,760128$490.52
August$73,991458$161.49
September$81,846601$136.18
October$88,022607$145.05
November$98,414721$136.40
December (to the 28th)$86,201581$148.47
Six months$491,2343,096$158.66

From August to the September–December average, monthly spend rose 19.8% and monthly purchases rose 37.0%. Cost per purchase went down as spend went up.

Why doesn’t healthcare e-commerce scale like other stores?

From the outside it looks like any direct-to-consumer store. Inside the ad account it isn’t. Policy rules, product restrictions and approvals add friction at every step.

For most stores, Shopping is the clearest way to catch buyers who already know what they want. In healthcare, Shopping is often delayed or blocked by approvals. And when purchases aren’t tracked well, accounts drift toward easier numbers like registrations. That keeps an account running. It doesn’t let it grow.

What was broken?

  • Purchase tracking wasn’t reliable. Registrations were recorded. Purchases weren’t captured well enough for Google to bid on them.
  • Shopping wasn’t live. Merchant Center wasn’t fully set up, so the account had no Shopping at all.
  • More spend would have bought more noise. Without clean purchase data or Shopping, raising the budget meant spending harder, not better.

What changed, and in what order?

  1. Purchase tracking repaired. Real purchases became the number Google bid on, instead of registrations.
  2. Merchant Center fixed. The product feed was made stable and compliant, so Shopping could run.
  3. Shopping launched. Over the six months, the main Shopping campaign was the account’s second-biggest campaign by spend.
  4. Judged on cost per purchase. Registrations stayed as a quality check, not a stand-in for sales.

Spend only went up after the first two were in place.

How was this measured?

Ad spend and purchases come from the Google Ads account, for every campaign in it, July 1 to December 28, 2025. The window stops on December 28 so the last week is whole. Purchases are the account’s purchase conversion, by the day of the click, so some are fractions and the totals are rounded.

An earlier version of this page counted a narrower set of campaigns, which made cost per purchase look lower. This one counts all of them. These are purchases Google reported, not a count of new customers.

What got worse?

July. $490.52 per purchase, while tracking was being fixed.

December. Cost per purchase rose to $148.47, from $136.40 in November. Year-end auctions, seasonal buying and product mix all move that. Tracking and Shopping stayed in place.

What would I take from this?

Fix what Google counts before asking it to spend more. Here, that meant purchase tracking first, then the feed, then Shopping, and only then a bigger budget.

The New-Customer Read

Is Google counting the right thing in your account?

A free 30-minute Google Ads review with me. You keep the 3 things I’d fix first.

Get my New-Customer Read