.png)

From the outside, this business looked like one unified brand with centralized marketing. In reality, it operated like fourteen separate businesses, each with its own staffing, booking behavior, cancellation patterns, pricing realities, and local economics. That is what makes franchise acquisition so fragile in home services.
Performance was being judged largely through the Google Ads interface, but platform reporting could only show front-end activity. It could not reveal what actually got booked, what canceled, or what turned into revenue. As a result, performance conversations became fragmented. Some locations were growing well, while others were overwhelmed by poor-fit demand or operational leakage.
The issue was not a lack of leads. It was a lack of clarity.
Before the system was rebuilt, three issues made performance difficult to evaluate:
This is the central tension in franchise marketing: the brand wants scale and predictability, but each location needs acquisition economics that work locally.
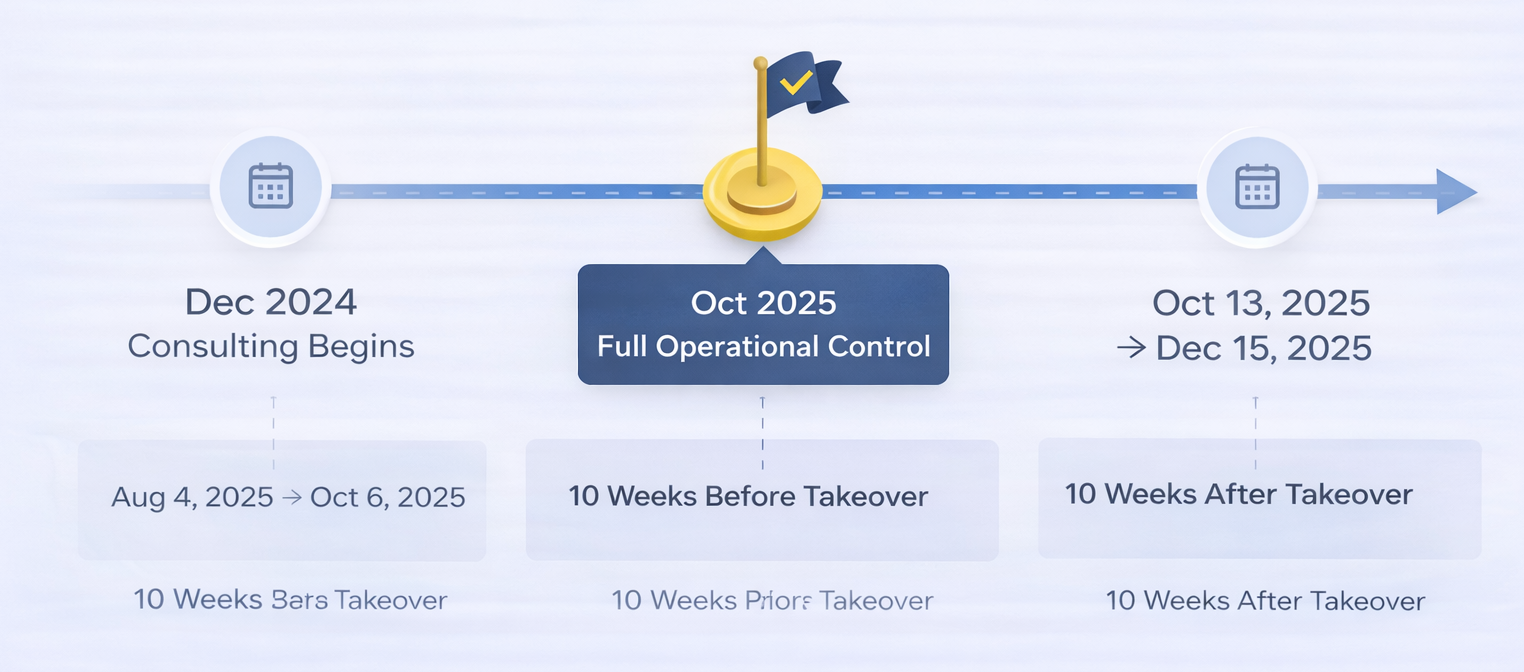
I began consulting in December 2024, but the real inflection point came roughly ten months later, when I took full operational control of the Google Ads accounts across the network. That shift allowed performance to be evaluated through business outcomes rather than platform abstraction, and it made it possible to redesign the acquisition system as a whole instead of patching issues location by location.
To isolate the impact of those changes, I compared ten full weeks immediately before takeover, from August 4, 2025 to October 6, 2025, against ten full weeks immediately after, from October 13, 2025 to December 15, 2025. This helped reduce seasonality noise and made the comparison cleaner.
The goal was not to increase volume at any cost. It was to build a system that could scale across fourteen locations without flattening their differences.
For this case study, Google Ads reporting was used as an optimization tool, not as the final source of truth. Success was measured through internal dashboards that tracked the full business chain: qualified lead → booking → cancellation → revenue. Only leads that were internally audited and marked as qualified were counted.
That distinction matters because it means the gains shown below reflect business outcomes, not just better-looking platform metrics.
Once the new system was in place, the changes were immediate and measurable.
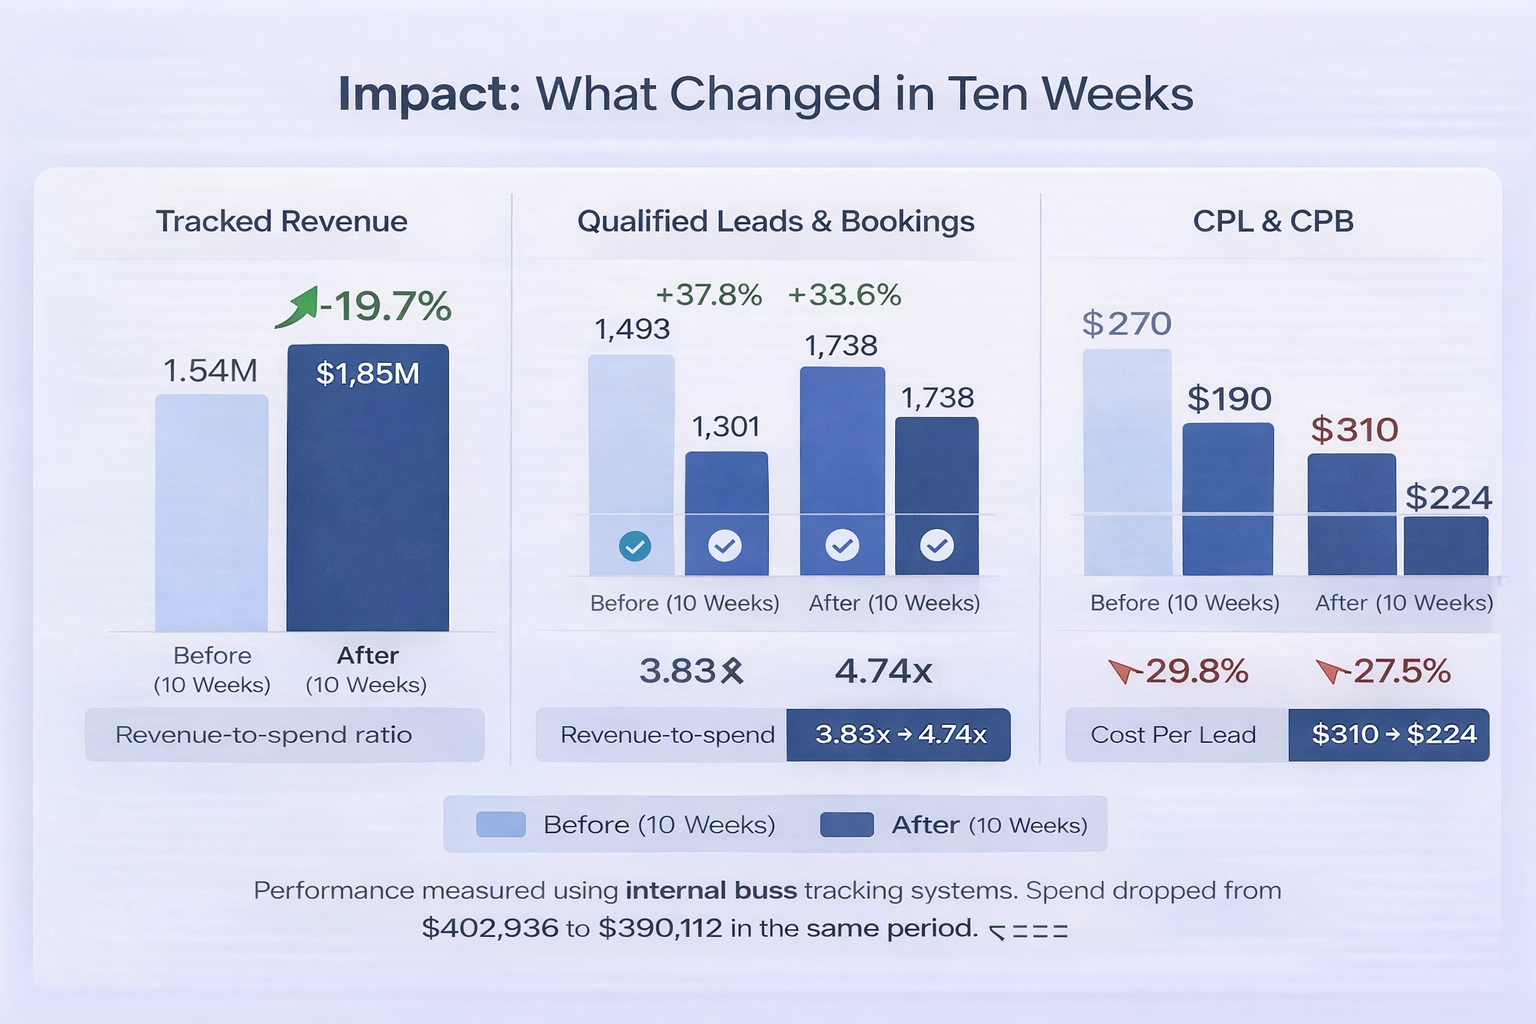
Across the network, ad spend declined slightly from $402,936 to $390,112, yet tracked revenue increased from $1,544,257 to $1,848,877, a 19.7% lift. Revenue-to-spend efficiency improved from 3.83x to 4.74x, a 23.7% increase in return.
The acquisition funnel also scaled in a healthier way. Qualified leads increased from 1,493 to 2,058, up 37.8%, while bookings rose from 1,301 to 1,738, up 33.6%.
Just as importantly, this growth did not come with lower quality. Cancellation rates improved from 16.45% to 13.86%, which translated to roughly 44–45 fewer cancellations than would have been expected if earlier behavior had held. In a home services business, that is not just a marketing metric. It is operational relief.
Efficiency improved across the board as well. Cost per qualified lead dropped from $270 to $190, while cost per booking fell from $310 to $224. This created more room for scale without requiring heavier budget pressure.
One result deserves explicit transparency: revenue per booking declined by approximately 10.4% during the post-takeover period. This was visible in internal reporting, but the exact cause could not be attributed to marketing alone. In a franchise system, revenue per booking is influenced by pricing, job mix, and sales execution, all of which vary from one location to another.
What matters is the overall business outcome. Even with a lower average ticket, the network still generated more tracked revenue on less spend, while improving efficiency and reducing cancellations. The gains outweighed the tradeoff.
To control for seasonality, the early holiday period was also reviewed year over year. Between early November and mid-December, tracked revenue increased by 27.7% year over year while spend declined by more than 21%. Revenue-to-spend efficiency improved by more than 60%, and cancellation rates fell materially.
Quarterly trends supported the same conclusion. From late 2024 through 2025, revenue-to-spend improved steadily while CPL, CPB, and cancellation rates all moved in the right direction. By mid-December 2025, the network was operating at a 4.6x revenue-to-spend ratio with healthier unit economics overall.
This case study is not really about outperforming Google Ads. It is about building an acquisition system that respects the full operating chain: ad → qualified lead → answered call → booking → kept appointment → revenue. Marketing influences the front end of that chain, but operations determine what happens after the lead comes in.
Franchise growth works best when the system is standardized enough to scale, localized enough to remain profitable, and disciplined enough to move based on business reality instead of averages or platform metrics alone. In this case, the ten weeks after takeover delivered higher revenue, lower costs, stronger efficiency, and fewer cancellations across fourteen independent businesses.
If you're done guessing, reacting, and relying on random tactics, the next step is simple.Fill out the form below to start building a clearer, more profitable growth system.