.png)

Over sixteen months I managed $3.88M of ad spend on a clean-beauty DTC account and drove $20.4M in tracked revenue, at 5.25x. Monthly spend went from $94,449 when I inherited it to a peak of $360,148, and monthly revenue rose $607,507 — with every extra dollar of spend returning $3.45. The account got there by rebuilding the half nobody could see: only 17% of spend was traceable to a readable search query at handover, and 57% was by the end.
The part most case studies leave out is that the first quarter of that rebuild looked like a failure. Spend doubled and tracked revenue fell 14%. That section is still in here, along with the channel I got wrong.
On this page
- What did the account look like at handover?
- Why replace an account that was returning 8.69x?
- What did the rebuild cost in the first quarter?
- Where did the account end up?
- What structurally changed underneath the numbers?
- What did I get wrong?
- How was this measured?
What did the full engagement look like?
| Jul 2023 – Oct 2024 | Total |
|---|---|
| Ad spend managed | $3,879,652 |
| Tracked revenue driven | $20,379,092 |
| Blended return on ad spend | 5.25x |
| Tracked conversions | 126,823 |
| Monthly spend, inherited → peak | $94,449 → $360,148 |
Sixteen months, one operator. The rest of this page is how that happened, including the quarter where it went backwards.
What did the account look like at handover?
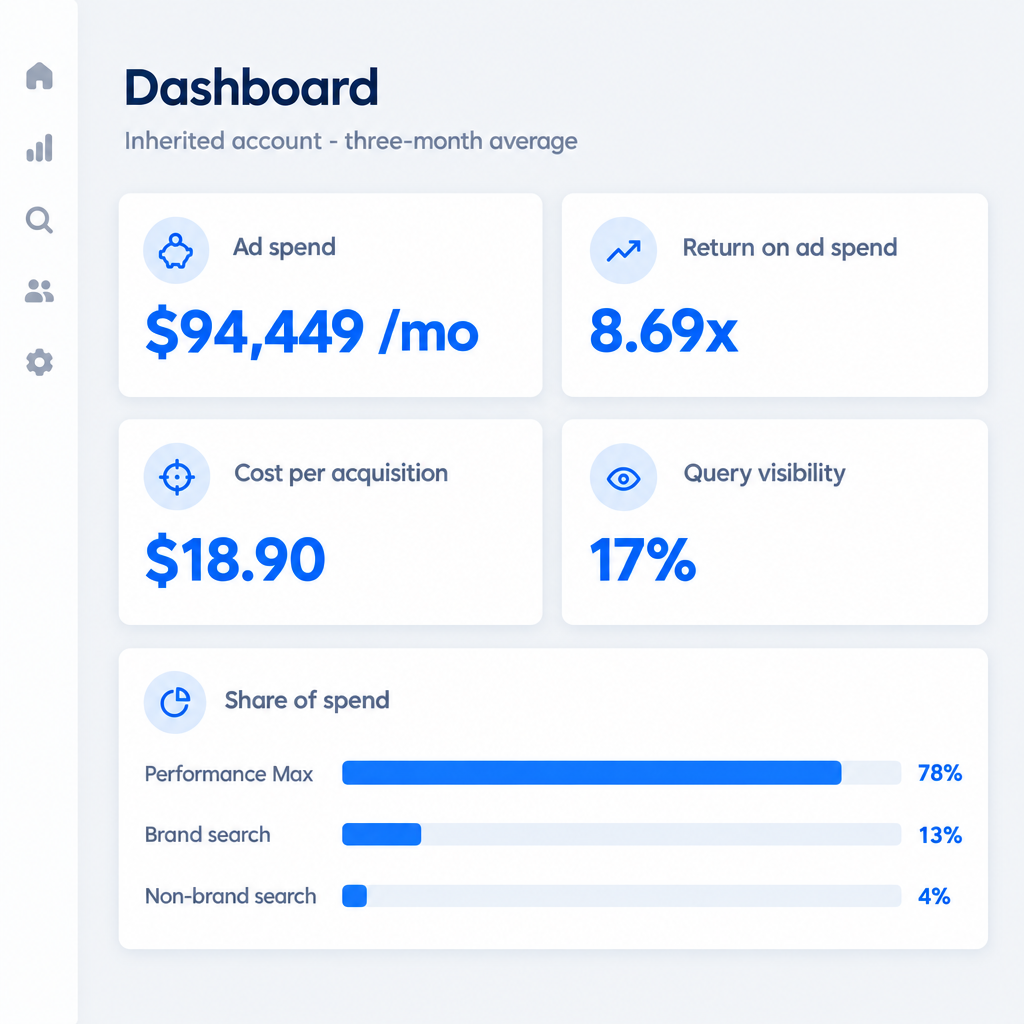
On the surface, excellent. Across the three months before I touched it the account averaged $94,449 a month in spend against $820,779 in tracked revenue — 8.69x, at $18.90 a conversion.
Underneath, it was barely buying anything new.
- Brand search took 13% of spend at 40.9x and produced roughly 60% of all tracked revenue. That is demand that already existed, being harvested cheaply.
- Performance Max took 78% of spend at 4.06x, reporting almost no search queries.
- Non-brand search ran at $4,133 a month — about 4% of budget.
The most important number was none of those. Only 17% of spend was attributable to a search query anyone could read. The account was mostly a black box that happened to sit on top of a strong brand.
Why replace an account that was returning 8.69x?
Because 8.69x on a brand-heavy mix is not a performance result. It is a measurement of how good the brand already was.
A blended figure carried by brand search cannot be scaled. Every extra dollar has to go somewhere the account could not see, and there was no evidence about what happened when it did. The choice was to keep reporting a flattering number, or to rebuild the account so growth could be bought deliberately.
The teardown happened on a single day in July 2023. Nineteen campaigns recorded their final spend and two new Shopping campaigns recorded their first, on the same date.
What did the rebuild cost in the first quarter?
This is the part most case studies leave out.
| Three-month average | Inherited (Apr–Jun 2023) | After teardown (Aug–Oct 2023) |
|---|---|---|
| Spend / month | $94,449 | $191,865 |
| Tracked revenue / month | $820,779 | $706,410 |
| Return on ad spend | 8.69x | 3.68x |
| Cost per acquisition | $18.90 | $44.93 |
Spend roughly doubled and tracked revenue fell about 14%. Return on ad spend more than halved and cost per acquisition went up 138%.
That is what buying visibility actually costs. The account was being taught, from a standing start, which non-brand queries were worth anything — and for a quarter it paid tuition on every one of them. Anyone reviewing month three in isolation would have concluded the rebuild had failed.
Where did the account end up?
It turned in November 2023 and kept going.
| Three-month average | Inherited (Apr–Jun 2023) | Later (Aug–Oct 2024) | Change |
|---|---|---|---|
| Spend / month | $94,449 | $270,724 | +187% |
| Tracked revenue / month | $820,779 | $1,428,286 | +74% |
| Return on ad spend | 8.69x | 5.28x | −39% |
| Cost per acquisition | $18.90 | $27.66 | +46% |
| Return on the incremental spend | — | 3.45x | every new $1 returned $3.45 |
Read that table honestly. Return on ad spend went down and cost per acquisition went up. Both are supposed to look bad, and on a brand-harvesting account they would be.
What changed is what the money was buying. The account was spending 2.87x more per month and returning 1.74x more revenue, with the growth coming from queries the original account could not see, let alone bid on. A lower blended return on a much larger, mostly-new base is a different business from a high blended return on demand that would have converted anyway.
If the goal had been to protect the 8.69x, the correct move was to do nothing at all — and the account would still be at $94,449 a month.
What structurally changed underneath the numbers?
- Query visibility went from 17% to 57%. The share of spend traceable to a readable search query more than tripled. This is the number the rebuild actually bought.
- Brand's share of spend fell from 74.0% to 36.0%. The account stopped being mostly a brand-harvesting operation.
- Non-brand became a real engine rather than a $4,133-a-month rounding error, on generic category demand — organic makeup, non-toxic makeup, clean makeup, best foundation for mature skin.
What did I get wrong?
YouTube.
Across the engagement I put $625,864 into video — about 16% of everything spent — and the tracked return on it sat far below the account's blended level. At its peak it was taking more than a third of the monthly budget.
Two honest qualifications. Video's assist contribution on a last-click basis is genuinely unmeasurable, so the tracked figure understates whatever it really did. And from mid-2024 some of those campaigns were pointed at add-to-cart and initiate-checkout rather than purchases, which guaranteed the purchase-basis return would read badly.
Neither qualification makes it a good decision. It was too much budget, for too long, on the channel with the weakest evidence in the account. Anyone who gets access to the account finds this, so it belongs in the write-up rather than in a footnote.
How was this measured?
Everything above is pulled from the account's own monthly reporting — spend, tracked conversion value, and conversions — and every figure is a three-month average rather than a single month, because single months in this category swing hard on promotional timing.
The comparison windows are deliberately conservative. The opening baseline is the three full months before any change was made. The closing window is a three-month period comfortably inside the engagement rather than the final weeks, so no figure here depends on exactly where the engagement ended. Peak-season months are excluded from both ends, so neither side is flattered by seasonality.
Client name, product names and competitor names are withheld.
What would I take from this?
- A blended return is not a performance number when brand carries it. Ask what share of revenue came from people who already knew the name.
- Rebuilds cost a quarter. If the first three months of a restructure look better, the restructure was probably cosmetic.
- Visibility is the asset. Not the return multiple — the share of spend you can actually explain.
- Report the channel that lost money. It is the only way anyone can tell the rest of the numbers are real.
Written by Usama Khan, who runs Google Ads for e-commerce brands and home-services companies at AdventurAds. Figures are from an account under active management at the time and are anonymised. Last reviewed 2026-09-09.