.png)
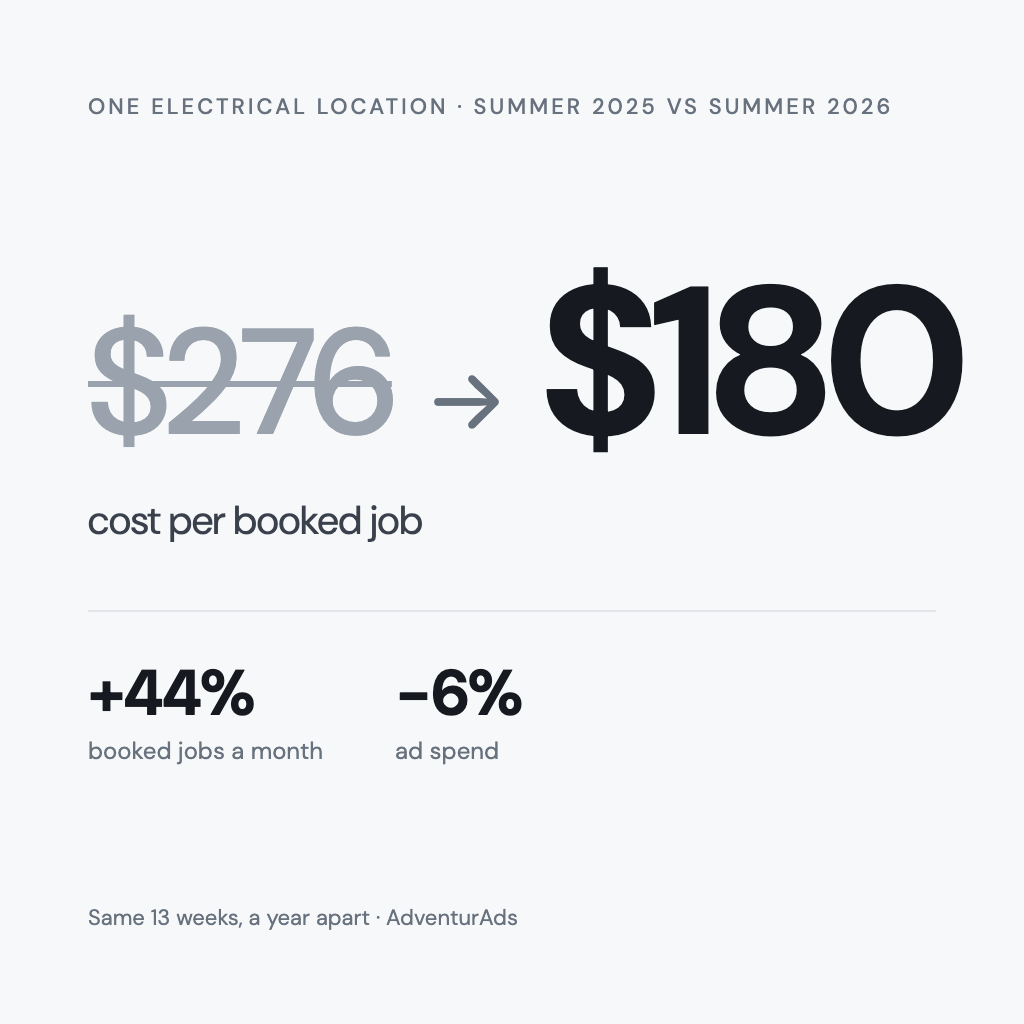
In summer 2026, an electrical location I run booked 44% more jobs a month than in the same 13 weeks of 2025, on 6% less ad spend. Cost per booked job fell from $276 to $180. Since I took full control in October 2025, it has spent $256,221 on ads and logged 1,213 booked jobs from them, at $211 each.
The change the weekly numbers line up with came on June 25, 2026. Two return targets were set tighter than the location could hit, and I loosened both. It wasn’t the only change that summer, and not everything got better. The jobs got smaller, and tracked revenue fell 13.6%. Both are on this page.
On this page
- What did the full run look like?
- What did the location look like a year earlier?
- What went wrong in late June 2026?
- What changed on June 25, 2026?
- What happened to booked jobs week by week?
- How did the summer compare with a year earlier?
- What else changed, and when?
- What got worse?
- How was this measured?
- What would I take from this?
- Questions owners ask about this
What did the full run look like?
| Oct 6, 2025 – Sep 6, 2026 | Total |
|---|---|
| Ad spend managed | $256,221 |
| Booked jobs from the ads | 1,213 |
| Cost per booked job | $211 |
| Weeks with ads running | 48 of 48 |
| Booked jobs a month, summer 2025 → summer 2026 | 86 → 123 |
One location, one Google Ads account, 48 weeks. The rest of this page covers the summer comparison, the change the weekly numbers line up with, and what it cost.
What did the location look like a year earlier?
It’s one location of a 14-location electrician franchise. It has its own Google Ads account, its own budget and its own service area.
From June 9 to September 7, 2025, another agency ran the account. I had been advising since December 2024, alongside that agency, with no control of the account. Over those 13 weeks:
- Ad spend: $23,621 a month
- Booked jobs: 86 a month
- Cost per booked job: $276
- Tracked revenue per booked job: $1,581
I took full control of the account in October 2025. I still run it.
What went wrong in late June 2026?
The location’s two main campaigns for people searching for an electrician, not for the company by name, bid to a return target. That’s the booked-job value you tell Google to aim for from each $1 of ad spend. A 500% target asks for $5 back for every $1.
Google only sees some of the jobs that get booked. So a target that looks reachable on paper can ask for more than the location really earns. When that happens, Google bids on far fewer searches and the budget goes unused.
That’s what happened here. The Performance Max campaign (Google’s campaign type that shows your ads on Search, Maps, YouTube and more from one budget) had a $550-a-day budget it wasn’t spending. The budget wasn’t the limit. The target was.
| Week of | Spend | Jobs |
|---|---|---|
| Jun 8, 2026 | $5,800 | 22 |
| Jun 15, 2026 | $5,000 | 30 |
| Jun 22, 2026 | $2,900 | 13 |
Both targets were set on my watch. And on June 8 I had lowered the value Google puts on each booked job, to bring it closer to real tickets. A lower value makes a return target harder to hit. That likely added to the squeeze.
What changed on June 25, 2026?
On Thursday, June 25, I loosened both targets.
| Campaign | Before | After |
|---|---|---|
| Performance Max | 500% | 450% |
| Main search campaign | 410% | 350% |
It was one clear step, not a run of small ones. When a target is choking spend, small steps keep it choked for longer. Nothing else in the account changed that day.
A looser target lets Google pay more for a click. The test was whether those clicks turned into booked jobs at a cost the location could carry.
What happened to booked jobs week by week?
| Week of | 2026 | 2025 |
|---|---|---|
| Jun 8 | 22 | 29 |
| Jun 15 | 30 | 22 |
| Jun 22 (change Jun 25) | 13 | 22 |
| Jun 29 | 28 | 22 |
| Jul 6 | 40 | 25 |
| Jul 13 | 35 | 22 |
| Jul 20 | 28 | 16 |
| Jul 27 | 25 | 19 |
| Aug 3 | 29 | 19 |
| Aug 10 | 31 | 20 |
| Aug 17 | 30 | 21 |
| Aug 24 | 26 | 11 |
| Aug 31 | 33 | 9 |
Booked jobs a week, in 2026 and in the same week of 2025.
Before the change, the location booked 22 and 30 jobs a week. In the week of the change, 13. In every week after it, through the week of August 31, between 25 and 40. Weekly ad spend came back to between $4,100 and $7,700.
In the two weeks before the change, the location booked 52 jobs, against 51 in the same two weeks of 2025. The gap opened after it.
In the 10 full weeks after the change, it booked 305 jobs on $53,058 of ad spend, $174 each. In the same 10 weeks of 2025, it booked 184 jobs on $51,615, $281 each.
How did the summer compare with a year earlier?
June 9 to September 7, 2025, against June 8 to September 6, 2026.
| 13 weeks | 2025 | 2026 |
|---|---|---|
| Ad spend a month | $23,621 | $22,230 |
| Booked jobs a month | 86 | 123 |
| Cost per booked job | $276 | $180 |
Ad spend down 5.9%. Booked jobs up 44.0%. Cost per booked job down 34.6%.
Same 13 weeks of summer, a year apart, so the season isn’t the difference. Every week in both windows had ads running.
What else changed, and when?
- December 2024. I start as an outside adviser. Another agency runs the account.
- October 2025. I take full control.
- June 8, 2026. I lower the value Google puts on a booked job, closer to real tickets. Main search budget up 10%.
- June 22. Booked-job value raised part of the way back. The brand campaign’s budget cap trimmed down close to what it was really spending.
- June 25. Both return targets loosened. The change this page is about.
- July 13. Booked-job value lowered again, closer to the real ticket.
- July 21. Booked-job value fixed to the location’s own history. The targets were rescaled at the same time so bids didn’t move.
- August 6. Saturday ads switched off at the client’s request, over weekend cancellations. Ads now run Monday to Friday. Main search budget up about 15%.
- August 12. A small EV-charger search campaign added, at $15 a day.
- August 17. Performance Max target reset to 511%. Main search budget up about 15%.
- August 31. Budgets raised on the brand, Performance Max and main search campaigns. The EV-charger campaign widened to six job types.
So June 25 isn’t the only reason the summer looks better. It’s the change the weekly numbers line up with. Bookings jumped the week after it, before any of the later changes. The rest of the summer ran with all of those changes in place, and I don’t credit the full 13-week result to one of them.
What got worse?
- The jobs got smaller. Tracked revenue per booked job fell from $1,581 to $949.
- Tracked revenue fell. $135,427 a month in summer 2025, $117,050 in summer 2026. That’s 13.6% lower. Revenue per $1 of ad spend went from $5.73 to $5.27.
- The summer beats the average. Across all 48 weeks since October 2025, a booked job cost $211, not $180.
- Fewer days to book. From August 6 there were no Saturday ads, at the client’s request.
More jobs at a lower cost each, but smaller ones. Whether that’s a better summer depends on what each job is worth after labour and parts, and on what those customers book next. Neither number is in the records this page uses.
How was this measured?
- Source. Spend, booked jobs and revenue come from the location’s weekly records, exported from the client’s job system. Weeks run Monday to Sunday.
- Spend checked against Google Ads. For the weeks I could check (June 15 to September 13, 2026), spend in those records matched Google Ads cost to the dollar.
- Booked jobs. These are jobs the records credit to the ads. Some of those customers might have booked anyway.
- Monthly figures. 13-week totals, divided by 13, times 52, divided by 12. Weekly spend in the tables is rounded to the nearest $100.
- Late weeks. Bookings for the weeks of August 24 and August 31 were read 8 to 15 days after each week ended. They may still change a little.
- What’s withheld. The client, the brand and the city.
What would I take from this?
- A campaign that won’t spend its budget is telling you something. Check the target before you add budget.
- Loosen a choking target in one clear step. Then give it a week or two before you judge it.
- Judge the ads on booked jobs in your own records. Not on what Google counts as a conversion.
- Watch the ticket size. More jobs is only a win if the jobs are worth doing.
Questions owners ask about this
Is this a whole franchise or one location?
One location. It’s part of a 14-location electrician franchise, but it has its own Google Ads account, its own budget and its own service area. In summer 2026 it spent about $22,200 a month on Google Ads.
What is a return target, in plain terms?
It’s the booked-job value you tell Google to aim for from each $1 of ad spend. At 500%, Google tries to bring back $5 for every $1. Set it higher than your jobs can deliver and Google bids on fewer searches, even with budget left over.
Didn’t loosening the targets make each job cost more?
Not here. A looser target lets Google pay more for a click. In the two full weeks before the change, a booked job cost $207. In the 10 full weeks after it, $174.
Why did revenue fall if bookings went up?
The jobs were smaller. Tracked revenue per booked job fell from $1,581 to $949. Tracked revenue a month came in 13.6% below the same weeks of 2025.
How do you know the jobs came from Google Ads?
The client’s job system credits each booked job to where the customer came from. Some of those customers might have booked anyway. In the same group, a location that ran no ads for 13 weeks still logged about 2 booked jobs a week. Read these as the jobs the records credit to the ads.
Will the same thing work for my shop?
I can’t promise a result. The method doesn’t change with the trade or the size: count real calls, send booked jobs back to Google, and set targets from what your jobs are worth. A single shop has fewer booked jobs for Google to learn from, so it takes longer. If you spend $10K or more a month on Google Ads and LSA, start with the Booked-Job Read. Under $10K a month, it’s not a fit yet. The Read will say what to fix first.
Want to see whether your targets are holding your spend back? Get your Booked-Job Read. It’s a 30-minute audit of your Google Ads and Local Services Ads with me. No fee.
Written by Usama Khan, who runs Google Ads for e-commerce brands and home-services companies at AdventurAds. Figures are from an account under active management and are anonymised. Last reviewed 2026-09-17.